MKR GSM 1400 Pre-flight Checklist

I’ve been getting to know the MKR GSM 1400 boards better the past few days, and in the process I’ve assembled a “pre-flight checklist” of things you’ll want to do first, in order to make sure everything is ready to go. It took a few errors and missteps to get here, so I’ll mention those along the way.

Make sure you have an antenna attached

I thought “I’ll be fine just to test, there’s good service in my city.” Wrong. Attach an antenna. You’ll need it to get a good signal even in a well-covered area. The GSM Antenna sold on the Arduino Store works well, though any GSM antenna with a SMA male connector should work.

Get a SIM card

I used Hologram.io, thanks to recommendations from the rest of the Arduino team and Don Coleman. Their Hologram Maker Edition service is affordable and easy to use. When you do set up an account, get a SIM card of course, and assign a phone number to it. That’s optional for their service, but needed if you want to send and receive SMS messages or phone calls.

You’ll also want to take note of the Device ID, APN info, and Device Key. You’ll need those later. When accessing GPRS services through the MKR 1400, the login is the Device ID and the password is the Device Key.

Download MKRGSM library

You can find this in the Arduino IDE’s LIbrary Manager. When you install it, you’ll get a new set of example sketches in the File Menu, Examples submenu called MKRGSM. You’ll need to have the right board chosen in the Tools menu (MKR 1400) in order for these examples to show up in the Examples submenu, though.

Run the TestModem Sketch

Click the File Menu, Examples submenu, MKRGSM submenu, Tools submenu to find the TestModem sketch. Upload this to your board and open the Serial Monitor. You should get the following output:

Starting modem test…

Then a slight delay, followed by:

modem.begin() succeeded
Checking IMEI…Modem's IMEI: XXXXXXXXXXXXXXX
Resetting modem…Modem is functoning properly

Your IMEI will be unique to your board, it’s the International Mobile Equipment Identifier. It’s written on the MKR1400, and encoded in the QR code there as well.

If you don’t get these messages, check that your SIM card is inserted properly, and that you’ve chosen the right board and serial port. Then upload the sketch again.

Run the BandManagement sketch

Click the File Menu, Examples submenu, MKRGSM submenu, Tools submenu to find the BandManagement sketch. Upload this to your board and open the Serial Monitor. You should get the following output:

Restarting modem…

Then a slight delay followed by:

Modem restarted.
Current band:EGSM_DCS_MODE
Want to change the band you’re on?
Select band:
1 : E-GSM(900)
2 : DCS(1800)
3 : PCS(1900)
4 : E-GSM(900)+DCS(1800) ex: Europe
5 : GSM(850)+PCS(1900) Ex: USA, South Am.
6 : GSM(850)+E-GSM(900)+DCS(1800)+PCS(1900)

Choose the right band for your region of the world. If you pick the wrong region, the MKR1400 will never connect to a network. I puzzled over this for several minutes before I thought to check the band, as I was in the US and the board came from Europe. Type the correct number in the Serial Monitor’s input field, then hit enter. You should get:

Configuring band GSM850_PCS_MODE

Or whatever mode is appropriate to your region. Then after a few seconds:

Success

Run the ScanNetworks sketch

Click the File Menu, Examples submenu, MKRGSM submenu, Tools submenu to find the GsmScanNetworks sketch. If your SIM card requires a PIN, enter it in the arduino_secrets.h tab. Upload this to your board and open the Serial Monitor. You should get the following output:

GSM networks scanner

Then a longer delay followed by:

Modem IMEI: XXXXXXXXXXXXXXX
Scanning available networks. May take some seconds.
Current carrier: T-Mobile
Signal Strength: 5 [0-31]
Scanning available networks. May take some seconds.
Current carrier: T-Mobile
Signal Strength: 5 [0-31]
Scanning available networks. May take some seconds.

This should be the first sketch that connects your MKR 1400 to the mobile network, so make sure you have an antenna attached. Your carrier name and signal strength will vary, of course. The scanning will run continually.

Once you see this, you know you’re on the mobile network. Now the fun begins.

Run the SendSMS sketch

Click the File Menu, Examples submenu, MKRGSM submenu, to find the SendSMS sketch. If your SIM card requires a PIN, enter it in the arduino_secrets.h tab. Upload this to your board and open the Serial Monitor. You should get the following output:

SMS Messages Sender

Then a delay followed by:

GSM initialized
Enter a mobile number:

Type your mobile phone number into the Serial Monitor’s input field, including the country code. For example, a typical US number would be +15551212. Then type enter. You should get the following output:

+15551212
Now, enter SMS content:

Type a message, something like this:

I like aardvarks and okapi, don't you too?

You should get the following output:

Message:
I like aardvarks and okapi, don't you too?

COMPLETE!

Enter a mobile number:

You should get the text on your phone number too, of course. Note that the sending phone number may not be the one associated with your SIM. This will depend on your carrier. Send a few more until you’ve exhausted that fun.

Run the ReceiveSMS sketch

Click the File Menu, Examples submenu, MKRGSM submenu, to find the ReceiveSMS sketch. If your SIM card requires a PIN, enter it in the arduino_secrets.h tab. Upload this to your board and open the Serial Monitor. You should get the following output:

SMS Messages Receiver

Then a delay followed by:

GSM initialized
Waiting for messages

Send a text message from your mobile phone to the number associated with your SIM card. You should get the following output:

Message received from:
+15551212
Oh, and llamas and bonobos are quite nice too.
END OF MESSAGE
MESSAGE DELETED

Now you know you’re successfully sending and receiving messages from the mobile network. Finally, test GPRS connectivity:

Run the GsmSSLWebClient sketch

Click the File Menu, Examples submenu, MKRGSM submenu, to find the GsmSSLWebClient sketch. Click the arduino_secrets.h tab and enter your APN info, login, and password. From Hologram.io, you hologram for the APN, use the Device ID as login and generate a Device Key as password. Hologram SIMs do not require a PIN. Check with your mobile provider for details on your own SIM. Upload this to your board and open the Serial Monitor. You should get the following output:

Starting Arduino web client.

Then a longer delay followed by:

connecting…
connected
HTTP/1.1 200 OK
Server: nginx
Date: Tue, 19 Mar 2019 13:48:40 GMT
Content-Type: text/plain
Content-Length: 2263
Last-Modified: Wed, 02 Oct 2013 13:46:47 GMT
Connection: close
Vary: Accept-Encoding
ETag: "524c23c7-8d7"
Accept-Ranges: bytes
`:;;;,` .:;;:. .;;;;;;;;;;;` :;;;;;;;;;;: TM `;;;;;;;;;;;;;;;` :;;;;;;;;;;;;;;; :;;;;;;;;;;;;;;;;;; `;;;;;;;;;;;;;;;;;; ;;;;;;;;;;;;;;;;;;;;; .;;;;;;;;;;;;;;;;;;;;
;;;;;;;;:;;;;;;;;; ,;;;;;;;;..;;;;;;;; .;;;;;;, :;;;;;;; .;;;;;;; ;;;;;;; ;;;;;; ;;;;;;; ;;;;;;, ;;;;;;. ,;;;;; ;;;;;;.;;;;;; ;;;;;;
;;;;;. ;;;;;;;;;;;``` ;;;;;
;;;;; ;;;;;;;;;, ;;; .;;;;;
;;;;:;;;;;;;; ;;; ;;;;;
,;;;;,,,,,,,, ;;;;;;; .,,;;;,,, ;;;;;
:;;;;.;;;;;;;; ;;;;;, :;;;;;;;; ;;;;; :;;;; .;;;;;;;; ;;;;;; :;;;;;;;; ;;;;; .;;;;. ;;;;;;;. ;;; ;;;;; ;;;;; ;;;;;;;;; ;;; ;;;;; ;;;;; .;;;;;;;;;; ;;; ;;;;;, ;;;;;;;;;;;;;;;;;; ;;;;;
;;;;;, .;;;;;; ;;;;;;; ;;;;;; ;;;;;;: :;;;;;;. ;;;;;;; ;;;;;; ;;;;;;; .;;;;;;;, ;;;;;;;; ;;;;;;;:
;;;;;;;;;:,:;;;;;;;;;: ;;;;;;;;;;:,;;;;;;;;;;
;;;;;;;;;;;;;;;;;;;. ;;;;;;;;;;;;;;;;;;;; ;;;;;;;;;;;;;;;;; :;;;;;;;;;;;;;;;;: ,;;;;;;;;;;;;;, ;;;;;;;;;;;;;; .;;;;;;;;; ,;;;;;;;;:
;;; ;;;;;` ;;;;: .;; ;; ,;;;;;, ;;. `;, ;;;; ;;; ;;:;;; ;;;;;; .;; ;; ,;;;;;: ;;; `;, ;;;:;;
,;:; ;; ;; ;; ;; .;; ;; ,;, ;;;,;, ;; ;; ;; ;: ;; ;; ;; ;; .;; ;; ,;, ;;;;;, ;; ;;.
;: ;; ;;;;;: ;; ;; .;; ;; ,;, ;;;;;, ;; ;;
,;;;;; ;;;; ;; ;; .;; ;; ,;, ;; ;;;, ;; ;; ;; ,;, ;; .;; ;;;;;: ;;;;;: ,;;;;;: ;; ;;, ;;;;;; ;; ;; ;; ;; ;;;;. `;;;: ,;;;;;, ;; ;;, ;;;;
disconnecting.

That text will appear as the ASCII-encoded Arduino logo in your Serial Monitor. Now you know you’ve got GPRS working, and should have enough functionality to proceed with your own sketches.

The MKRGSM library is based on similar principles as the WiFi101 and WiFiNINA libraries. Once you connect to the network, you use a variety of classes to do your business. The SMS class functions a bit like the Serial class, in that it’s based on the Stream class, so you can do things like see how many bytes are available(), you can read() and write(), and so forth. The GSMClient and GSMSSLClient classes function just like the TCP client classes in the WiFi libraries. Check the MKRGSM library documentation for more detail.
BlinkyTape using NeoPixel Library

Blinkinlabs is shipping their product now after their successful KickStarter campaign, and I got mine in the mail a couple days ago. I had a few minutes and thought I’d get a basic example up and running. The Blinkinlabs documentation was confusing to me, however. The “Simplest BlinkyTape Sketch” wasn’t. The code was more complex than I had hoped, and I couldn’t find documentation of the API, but I noticed there were some examples that used the Adafruit NeoPixel library. Those examples didn’t run for me, but I figured if there were NeoPixel examples in the BlinkyTape repository, it should be possible to run the thing with that library.

A quick look at the schematics for BlinkyTape confirmed that it was indeed running the Atmega32U4, same as the Arduino Leonardo (their documentation’s good on setting the tape up as a Leonardo). Furthermore, the data in of the lights is connected to pin 13.  From there, it was simply a matter of modifying the Adafruit NeoPixels to work on pin 13.

Like the BlinkyTape examples, most of the Adafruit NeoPixel library examples were all about color scrolling. I dislike color scrolling. Call me old and cranky, but I remember a time when lighting designers made color choices and stood by them; when the designers of lighting tools gave us controls that let us choose those colors easily. I’m hoping that someday we’ll look back on this era  see color scrolling as a lighting design choice the same way as we see the mullet in hairstyle choice: a bad idea we had to go through to get to something more pleasant. Now you kids, get outta my yard! </cranky old man rant>

My sketch works like this: you send a serial string to the Arduino starting with a capital C, followed by the pixel number, the red level (0-255), the green level (0-255) and the blue level (0-255). The NeoPixel library then sets the color of the pixel you chose. That’s it.

Now that I know this thing’s so simple to use, I can see a lot of projects with it. Love the built-in processor too, makes it even more convenient. Makes me want to order a whole lot more NeoPixels from Adafruit too.

Here’s the code. You can also get it from gitHub.


[github_cv url='https://github.com/tigoe/NeoPixel_examples/blob/master/BlinkyTape/BlinkyTape.ino']

Serial to Browser using node.js

Updated 28 July 2015

This is a brief introduction to using node.js and websockets to connect a serial device, like an Arduino microcontroller, to a browser.

To make this happen you’ll need:

This post assumes you understand:

Datalogging with Arduino

There are several ways to save data from a sensor attached to an Arduino. If you’re connected to a personal computer, you can simply send the data from the Arduino to the personal computer serially, and save it to a file. If you’ve got an SD card attached to the microcontroller, you can save the data to the card. Or, if you have access to the internet and a device that can connect to a server, you can save the data to a server. In the tutorial below, you’ll read a DHT11 temperature and humidity sensor and log data in three ways:

  • Serial transmission to a personal computer, and serial capture to a file.
  • Saving data to an SD card mounted on the Arduino
  • HTTP upload to xively.com (formerly pachube.com) via an Ethernet shield or Ethernet Arduino.

Hardware you need:

  • personal computer
  • Ethernet Arduino and USB-to-serial connector, or Arduino Uno and Ethernet shield (or equivalents)
  • SD Micro card
  • DHT11 temperature and humidity sensor
  • 10-kilohm resistor

Software you need:

Concepts you should know:

  • Basic understanding of Arduino code
  • Basic electrical concepts
  • Serial communication concepts
  • How to install libraries in Arduino
  • HTTP request concepts

For more on the DHT sensors, see Adafruit’s tutorial.

To get started, install the Arduino IDE and download the DHT library. Unzip the library and change the directory name to DHT, then copy it to the libraries/ directory of your Arduino sketch directory. If this is your first time using Arduino, the default location is in your user directory, called Arduino/ . You might have to create the libraries directory inside the sketch directory. Then download the example sketches from my gitHub repository, unzip them and save them to your sketch directory as well. Then start the Arduino IDE.

Connecting the sensor

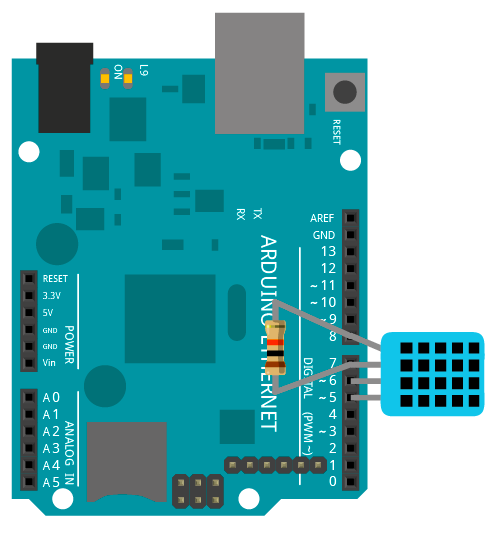
Connect the DHT11 sensor to the Arduino as follows:

  • Vcc (pin 1) – Digital pin 8
  • Output (pin 2) – Digital pin 7
  • Ground (pin 4) – Digital pin 5

Since the DHT11 sensor uses very little current, you can use the output pins of the microcontoller to power the sensor, using pins 5 and 8. Then attach the output pin of the sensor to pin 7. The output pin will also need a pullup resistor so that it goes high when no data is transmitted. To do this, connect the 10-kilohm resistor from pin 8 to pin 7, or to the +5V pin.

Serial Data Capture to a Graph

The simplest way to get data off the sensor is to print the results out serially and capture them directly on your computer. To make this happen, you’ll need your Arduino attached via a USB-to-serial connection. The sketch SerialTempHumidityReader uses the Adafruit DHT library to read the sensor and sends the results back to the computer serially. Download it and copy it into a new window in the Arduino IDE.

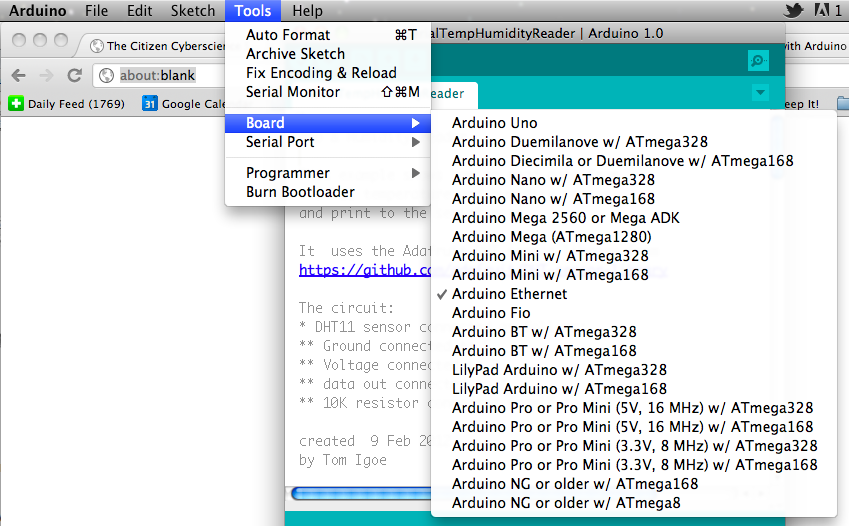
To upload the sketch to your board, connect the board to the computer via USB-to-serial, and look for the board type in the Tools > Board menu. Assuming you’re using an Arduino Ethernet, choose that:

To find your serial port, check the Tools >Serial Port menu with the USB-to-serial adapter NOT connected. Then plug the adapter into your computer again and check the menu again.  The new port that shows up is your USB-to-serial adapter’s port.

Once you’ve selected the board type and the port, upload the sketch by clicking the upload button in the toolbar, or ctrl-U:

When you’ve got the sketch loaded, open the serial monitor by clicking the Serial Monitor button on the right hand side of the toolbar.

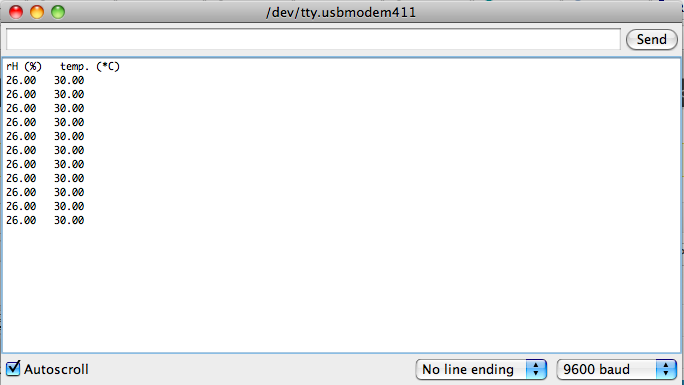
You should see readings like this:

The sketch is outputting tab-separated data, and prints out column headers at the beginning.

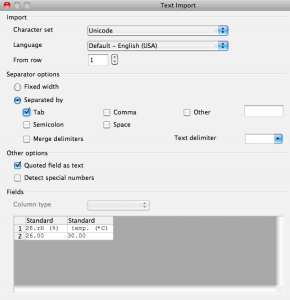
When you’ve got several readings, click in the serial monitor window, select all (ctrl-A), and copy (ctrl-C). Then open a blank spreadsheet in OpenOffice and paste the results into the sheet. When the Text Import dialog comes up, make sure you click Separated by Tab in the Separator options:

Select the two columns of numbers, and click the graph icon. In the Graph dialog box, choose Line type, the Lines Only option, then click Finish. Your graph will be inserted in your spreadsheet. Voila, graphing made simple!

Serial Data Capture to a File

If you have a serial terminal program like CoolTerm on your computer, you can also capture to a file. To do so, open CoolTerm, and choose your serial port in the Options menu. Click the Connect icon, then from the Connection Menu, choose Capture to TextFile… and Start. Give your file a name and save.

Note: if you want the file to start from the beginning of your sketch, hold down the reset until you’ve started capture.

To stop capture, choose Connect > Capture to TextFile… > Stop. Then you can use your file in any application you want. Change the file extension to .csv and you can open it in a spreadsheet and graph as above.

Saving Data to an SD Card

Sometimes you want to save data when you’re not connected to a personal computer. Attaching an SD card to an Arduino is fairly straightforward. There are several different shields that have SD cards on board, and the Arduino Ethernet has an SD card right on the main board. The SD card library makes it simple to save files to your SD card.

Format a microSD card as FAT16 or FAT32 on your personal computer, and load it onto your Arduino. Then upload the SDCardDataLogger sketch. This sketch reads the sensor using the Adafuit DHT library, and if there is an SD card present and initialized, it saves the results to a file called “DATALOG.CSV”. Transfer this file to your computer and use it as you wish. You can open it in a spreadsheet and graph it as you did above, or anything else you wish.

Posting data to Xively.com

If your Arduino is connected to the internet via Ethernet, you can connect to pachube.com and program it to post data there. Then you can use Pachube’s data storage and graphing tools to save and visualize your data.

Set up a xively.com account. Click Create a Feed. Give it a name, add any descriptive tags you want, and add a location if you wish. Add two datastreams called rH (relative humidity) and temp (temperature) as follows:

Write down the feed number and fill it into the feed variable in the sketch (PachubeDataLogger). You’ll also need your API key, which is a long string that identifies you to pachube.com. Click My Keys from the pachube menu to get your key. Copy it into the apiKey variable in the sketch below.

Upload this sketch to your Arduino, and connect the board to the net via Ethernet. Open the serial monitor. When the sketch starts, it will look for an IP address using DHCP. Then every ten seconds, it will read the sensor and try to upload to Pachube. A successful upload will print out something like this:

192.168.2.6
rH,26.00
temp,30.00
connecting...
data uploaded
HTTP/1.1 200 OK
Date: Sat, 16 Feb 2012 10:03:14 GMT
Content-Type: text/plain; charset=utf-8
Connection: close
X-Pachube-Logging-Key: logging.G5DkQtnxEdwyKbk0KSKI
X-PachubeRequestId: 0b4efe30282b715276cf1f849f7123ed3eaba234
Cache-Control: max-age=0
Content-Length: 1
Age: 0
Vary: Accept-Encoding

When you look at your feed, you’ll see a graph of your temperature and humidity.

Now you’ve got several methods to log data from an Arduino. You can change the sensor to any sensor you wish, and revise the sketches shown here to read that sensor instead of the DHT11. Enjoy!

Update

I’ve added code to the repository for this tutorial that shows how to use the Pachube code with a BMP085 barometric pressure sensor. Thanks to Adafruit for the excellent library for this sensor.  I’ve also added an example showing how to use the BMP085 with the SD card, and with a Realtime Clock. Again, Adafruit’s library for the RTC makes this easy.

Update 2

Pachube became xively.com, and then they became part of the Google IoT Cloud platform, so I can’t vouch for the validity of any of the pachube examples on this page now. They may work, if xively/Google didn’t change the API.


Networked Bed Presence sensor

John Schimmel and I had a meeting with a friend the other day who has chronic condition, and is looking for tools to notify her family and friends of her activity at home, so she can live more independently. A lot of good ideas came up, making for a potentially exciting project that’d be useful someone we care about: a win-win situation.

One of the ideas she had was a bed sensor, which would let her family know whether she’s in bed or not, so they can call to either wake her up, or tell her to get some rest if she’s up too late. Inspired by Mustafa Bagdatli and Diego Rioja’s BedData project, and assisted by them, we thought we’d see if we could put something together quickly, connecting force sensing resistors to an Arduino and using an Ethernet shield to upload data to Pachube.  The project has not been tested in the field yet, but it’s working in the lab, and was simple to set up.  It may be a useful example for other sensor projects.

Continue reading “Networked Bed Presence sensor”

Using PepperMill to turn a motor into a sensor

Nicolas Villar sent me a sample of the PepperMill, a new sensor board he and Steve Hodges designed at Microsoft Research in Cambridge, UK.  It’s a nifty little board.  You attach a DC motor and the board can an output voltage when the motor is turned,  and analog signals telling you the direction and speed of the motor.  It turns a DC motor into a rotary encoder, of sorts.

Continue reading “Using PepperMill to turn a motor into a sensor”

Rob Faludi just turned me on to CoolTerm, a serial terminal app for OSX and Windows. It looks like a nice addition, and is cross platform, which is handy for teaching; no need to reference different apps on different platforms. I’ve only tried it out a little, but so far, it’s nice. You can have multiple ports open in multiple windows, and you can see bytes in ASCII or hex. It’d be nice to see them in decimal too, but that’s just a wish.