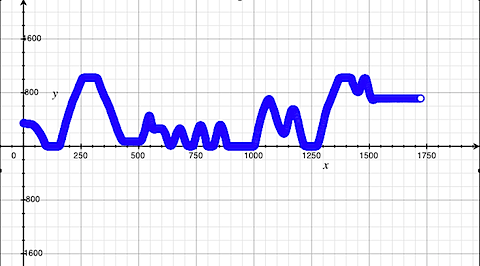
I’ve been looking for simple ways to graph the data from a sensor attached to a microcontroller lately, because it’s such a necessary activity if you want to look at sensor data over time. Using Apples Grapher program, which comes with OSX, I found a simple way that involves only four lines of code on an Arduino or Wiring microcontroller, and produces graphs like this:

Grapher lets you import text files with data point values. So here’s the procedure:
- Program microcontroller to send out comma-separated time and sensor values.
- Use screen program to save serial values to a file
- convert file to a comma-separated value file (.csv)
- open file in Grapher
1. Program the microcontroller Here’s the code for a Wiring or Arduino microcontroller. It prints the time in 100ths of a second, and the sensor reading at that time:
void setup() {
	// initialize the serial port:
	Serial.begin(9600);
}

void loop() {
	// print the time, in 100ths of a second:
	Serial.print(millis()/10);
	// print a comma:
	Serial.print(",");
	// print the sensor value (connected to analog pin 0):
	Serial.println(analogRead(0));
}
Note that the last line is a println(). That makes sure that each sensor reading gets its own line.2. Use screen to save the values
The screen program in OSX and other Unix and Linux operating systems is a command-line program that allows you to see data coming in the serial port. You can learn more about using it here. It can also save data to a file, using the -L option. To use it, open a Terminal window. Change directories to the Desktop by typing:
cd Desktop
Now open the screen program by typing:
screen -L serialportname
where serialportname is the name of your serial port. For example, a typical Arduino module (or FTDI USB-to-serial adaptor) might show up as /dev/tty.usb-A400133P. So you’d type screen -L /dev/tty.usb-A400133P.
As you hit the enter key to start the screen program, hit the rest button on your microcontroller. This will reset the time. A few seconds later, data will flow across the screen. When you’ve got enough data, type control-C to stop it, then control-A followed by control-\ to close the screen program.
3. Convert the file to a .csv file
If you look on the Desktop, you’ll see a file called screenlog.0. Open it in a text editor and save it as a text-only file called screenlog.csv.
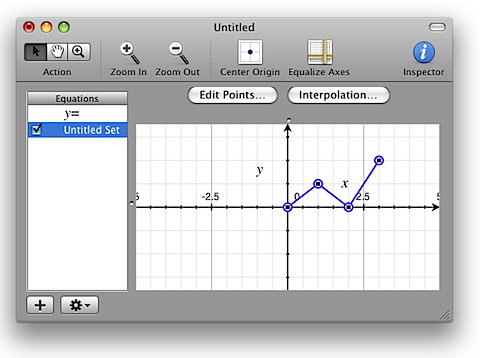
4. Graph the data Now open the Grapher application. It lives in the Applications/Utilities directory. Open a new default graph. From the Equation menu, choose “New Point Set”. A few new points will appear on the screen:
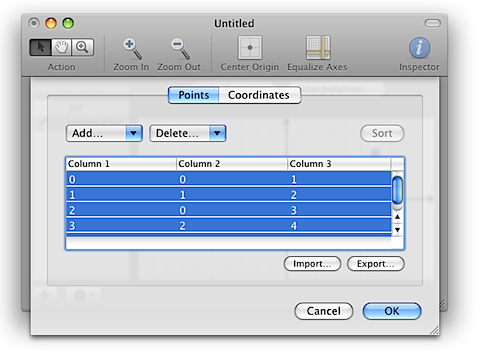
 Click “Edit Points” and you’ll get a list of the points and their values. Select all the points and delete them.
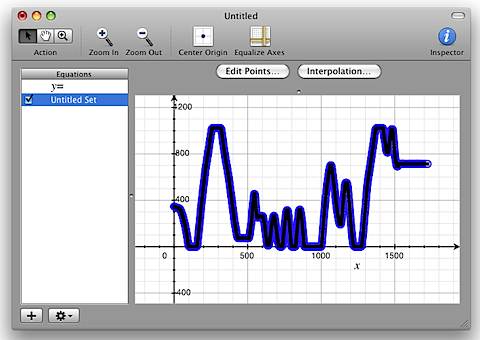
 Then click “Import ” and import your screenlog.csv file. Zoom out until you see the data points, and that’s it! For two sensor values at a time, you can send three values and view the graph in the 3D view as well.
